
Hands-on Genome Assembly Tools
(This workshop-style-lesson is taught on the Pete supercomputer at OSU)
DISCLAIMER: Some of these software (not all) nearly obsolete.
We are using them to demonstrate some processes used in bioinformatics. We want you to know you can do this! But be aware that open source software stops working eventually if is not actively maintained. The software used in this beginner’s introduction are already suffering from “Software collapse” a term introduced in 2019.
Why are we using older software?
Bioinformatics is rapidly developing and most software used for many important bioinformatics processes like assembly, could be updated multiple times before the semester completed! (This is also why we don’t use a textbook)
Online learning repositories such as The Carpentries, including Software Carpentry and Data Carpentry (which this course uses) are needed for their carefully curated lessons, and also for their ability to remain current! Also consider free resources like Cyverse.
Do some research and find the best software for your project if you plan to perform assembly or RNA-Seq in your own experiments. There are many online tutorials but only some are well-maintained. In particular the Galaxy Project is a great place to find current bioinformatics software and tutorials.
For an interesting discussion about scientists using outdated software see this 2018 article Scientists Continue to Use Outdated Methods,
Assembly
Main Point!: Not all assemblers are the same or give the same results. Also note that there are assemblers that use a reference genome to assist in assembly (reference-guided assembly) as opposed to de novo assembly which does not use a genome as a reference.
Which genome assembler should I use?
- As inefficient as it seems, it’s generally good to run several assemblers and compare results to find the one best for your data! Also, if there is a good-quality reference genome, you should use it. We are using reference-guided assembly with VELVET, and SPAdes in this lesson. All of these assemblers use de-bruijn (K-mer) graph assembly methods.
- Some assembly software are optimized for specific organisms or types of data outputs. In these cases you can safely use the recommended assembler
Genome_size = Total_Kmers / peak_Kmer_coverage
For more information about K-mers and coverage, there is this EXTRA Page that explains why we want to estimate genome sizes. Briefly, K-mers represent a copy of all your sequencing data, broken into small fragments of an exact size.
This is useful because:
- Assemblers can be confused by repeated sequences and end up very inaccurate. This gives you a second opinion.
- You might not know anything about your genome size!
Imagine you had 30-billion base pairs of sequencing data, and you knew your coverage was “10-fold”, you could then estimate the size of your genome being sequenced was 3-billion base-pairs long (30,000,000,000 ÷ 10 = 3,000,000,000)
We are using several pre-made
.sbatchsubmission scripts, so let’s briefly review the structure of a submission script using thevelvetk29.sbatchwe’ll use later in this lesson as an example.
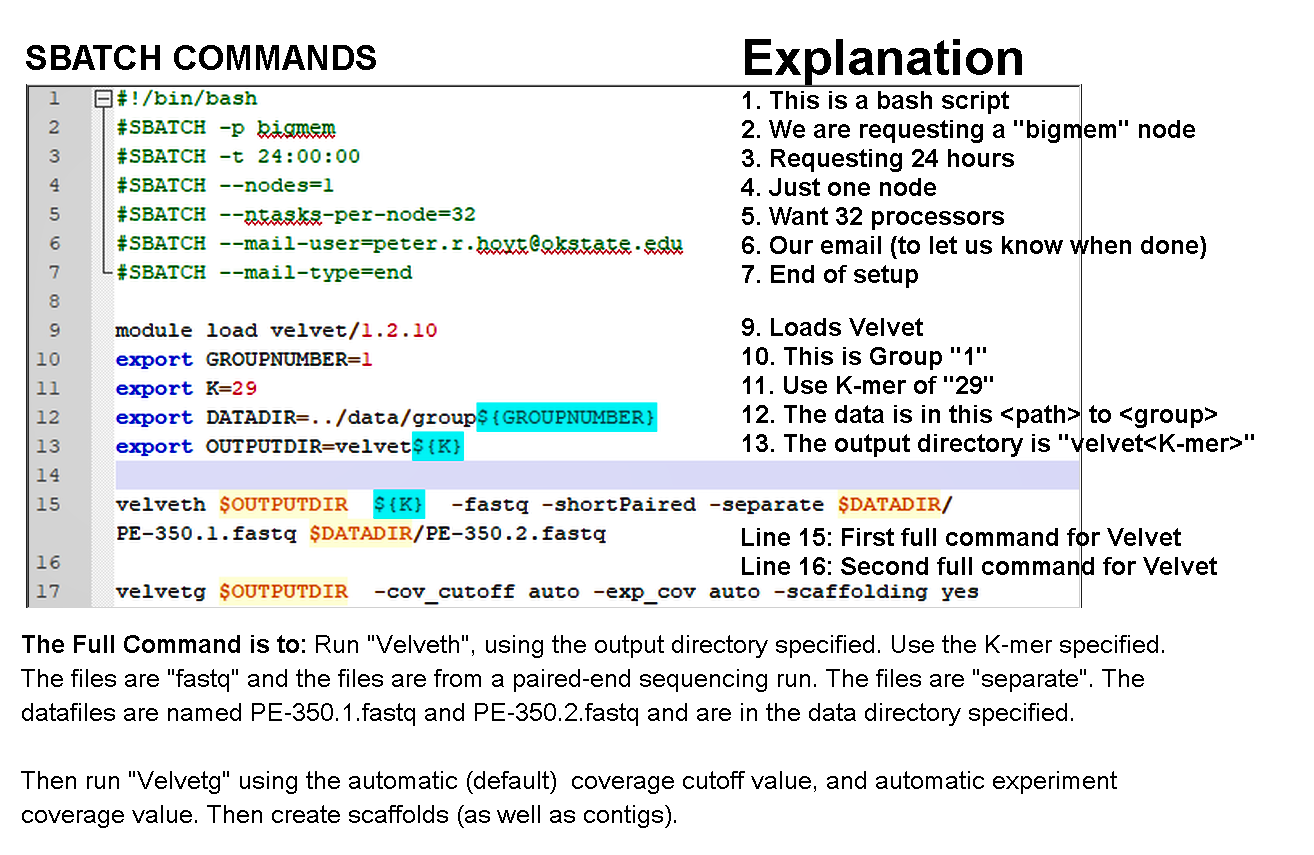
VELVET
$ cd ../../velvet/
Understand velvetk31.sbatch - We will use the text-file editor nano to examine our script file, that submits our data to the assemblers.
$ nano -w velvetk31.sbatch
Be sure to change the line:
export GROUPNUMBER=1
to your group number. You will need to do this for all the submission scripts today.
The first section of our velvetk31.sbatch script sets up the scheduler requests (the queueing system) and environment variables. The assembler commands are velveth and velvetg. What do these commands do? See the velvet website here.
If you understand the script and have changed the group number, press ctrl-x, save the file and submit it to the queue with the sbatch command as follows.
$ sbatch velvetk31.sbatch
What was printed on the screen after you pressed enter?
Submitted batch job <jobidnumber>
After the job is finished, the log file, your results will be in the velvet31 folder.
velvetk31.sbatch.o<jobidnumbmer> is very useful.
The log file, velvetk31.pbs.o<jobidnumbmer> is very useful and contains a lot of
the output data we want to look at.
Options to examine that output file:
$ tail velvetk31.sbatch.o<jobidnumber> (HINT: Try using TAB-completion to enter your commands!)
OR
$ less velvetk31.sbatch.o<jobidnumber>
You can scroll through the less interface by pressing the enter key
on your keyboard. Also, remember to press q to quit the less interface.
But here’s a trick to using less for searching:
At the bottom of the less interface, there is a “colon” character : to the left of your cursor.
If you press the forward slash button / on your keyboard, you will see the line is now blank.
It is waiting for a search pattern! Try entering something like “Paired end library” and press the Enter key.
Now use less tind these information from the log file:
Paired end library insert size: _____________
Standard deviation ______________
contig stats:
n50 ________
max contig length _______
total number of contigs __________
reads used ____________ (did it use all the reads?)
Where are the contigs stored? Transfer the results to the results folder!
$ cp velvet31/contigs.fa ../results/velvet31.fasta
Does the assembly get better if I use a different K-mer size?
To try different kmers, first copy your .pbs script with a new name:
$ cp velvetk31.sbatch velvetk21.sbatch
$ nano -w velvetk21.sbatch
and change K to a different value, currently 31. Try 21 first, and then 25. then submit this new job:
$ sbatch velvetk21.sbatch
Your results will be in the velvet31 subfolder.
To see kmer coverage differences in a histogram format, we can use the included Perl script on the velvet stats.txt file in each of your results folders:
$ module load velvet
$ velvet-estimate-exp_cov.pl velvet31/stats.txt
    10 |      1 | **********
<snip>
Predicted expected coverage: 18
velvetg parameters: -exp_cov 18 -cov_cutoff 0
This is a K-mer histogram.
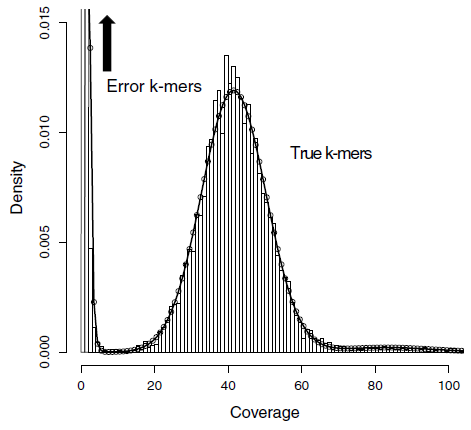
You should learn that when using K-mer based assembly methods, “good” K-mers show a peak where coverage is the most accurate. K-mers at low coverage tend to be those with many errors, and so they are ignored (we’re going to ignore them too!). The coverage histogram displays “coverage” vs. the “Number of K-mers”. The number of K-mers at every useful level of coverage are shown.
Here’s another trick: You can use this K-mer histogram to estimate the size of the genome you sequenced using the following formula:
Genome_size = Total_Kmers / peak_Kmer_coverage
Why do we want to estimate genome sizes? Briefly, K-mers represent a copy of all your sequencing data, broken into small fragments of an exact size. Software can estimate your coverage of the genome based on the number of “good” K-mers.
This is useful because:
- Assemblers can be confused by repeated sequences and end up very inaccurate. This gives you a second opinion.
- You might not know anything about your genome size!
Imagine you had 30-billion base pairs of sequencing data, and you knew your coverage was “10-fold”, you could then estimate the size of your genome being sequenced was 3-billion base-pairs long (30,000,000,000 ÷ 10 = 3,000,000,000)
To calculate “Total_Kmers”, sum all the numbers of all your K-mers. This is (approximately) the total number of all your “good” K-mers.
The formula above estimates the genome size based on K-mer histogram. What is your Group’s
genome size estimate? ________ bp.
CONGRATULATIONS on your first assembly!
SPAdes
SPAdes (SPAdes – St. Petersburg genome Assembler) – is a MODERN assembly toolkit. It is one of the most powerful asssembly software because it has several built-in pipelines. SPAdes works with Illumina or IonTorrent reads and is capable of providing hybrid assemblies using PacBio, Oxford Nanopore and Sanger reads. You can also provide additional contigs that will be used as long reads. SPAdes supports paired-end reads, mate-pairs and unpaired reads. SPAdes can take as input several paired-end and mate-pair libraries simultaneously. Note, that SPAdes was initially designed for small genomes, but is used for many larger genomes when computation power is available. In addition to genome asembly, SPAdes 3.12.0 includes the following additional pipelines:
- metaSPAdes – a pipeline for metagenomic data sets (see metaSPAdes options).
- plasmidSPAdes – a pipeline for extracting and assembling plasmids from WGS data sets (see plasmidSPAdes options).
- rnaSPAdes – a de novo transcriptome assembler from RNA-Seq data (see rnaSPAdes manual).
- truSPAdes – a module for TruSeq barcode assembly (see truSPAdes manual).
SPAdes also provides stand-alone programs with relatively simple command-line interfaces for: k-mer
counting (spades-kmercounter), assembly graph construction (spades-gbuilder) and a
long read to graph aligner (spades-gmapper). So let’s begin:
$ cd ../../spades/
Learn how we run SPAdes by viewing spadesk31.sbatch
$ nano -w spadesk31.sbatch
Be sure to change the line:
export GROUPNUMBER=1
to your group number.
SPAdes has too many capabilities built-in to cover everything today, but be sure to read the SPAdes manual!
If you understand the script and have changed the group number, press ctrl-x, save the file and submit it to the queue with the sbatch command as follows.
$ sbatch spadesk31.sbatch
What was printed on the screen after you pressed enter?
Submitted batch job <jobidnumber>
When the job is complete, the log file, spades.log is found in the output directory named “K31” and is very useful.
At the top it shows you the command you used. It then shows the software versions
you loaded. This is very important for making your results reproducible.
Spades will even give you recommendations if it thinks you could get
better results using different settings.
To examine the output file:
less spades.log
Find these information from the log file (and remember press q to quit):
What is the Reads length of your sequences: _____________
What is the SPAdes version used? ______________
To find contig stats you need to use less to look at the contigs.paths file
What is the max contig length (“NODE_1” in contigs.paths) _______
Does the assembly get better if I use a different K-mer size?
To try different kmers, first copy your .pbs script with a new name:
$ cp spadesk31.sbatch spadesk21.sbatch
$ nano -w velvetk21.sbatch
and change K to a different value, currently 31. Try 21 first, and then 25. then submit this new job:
$ sbatch velvetk21.sbatch
Now remember to copy your output files to the results folder:
$ cp spades31/contigs.fasta ../../results/spades31.fasta
SPAdes doesn’t output an N50 score but it outputs lots of other information. We will see the N50 of the SPAdes output later in this Workshop lesson.
Congratulations! This lesson has shown you how you can assemble genomes using different software, and using different parameters (K-mers, in this lesson). Now we should check our assemblies in a process called “validation” before sending the best assembly to our collaborators! We will learn how to compare the overall assembly of all our assemblers in our NEXT LESSON