Data Science in Omics Introduction
An OMICS Course Part 1: Shell, Organizing and Genomics

A colleague of yours is working on a project on banner-tailed kangaroo rats (Dipodomys spectabilis) and is interested in what elevations these mice tend to occupy in the continental United States. You offer to help them out by getting some coordinates for specimens of this species and looking up the elevation of these coordinates.
Get banner-tailed kangaroo rat occurrences from GBIF, the Global Biodiversity Information Facility, using the spocc R package, which is designed to retrieve species occurrence data from various openly available data resources. Use the following code to do so:
 dipo_df = occ(query = "Dipodomys spectabilis",
             from = "gbif",
             limit = 1000,
             has_coords = TRUE)
 dipo_df = data.frame(dipo_df$gbif$data)
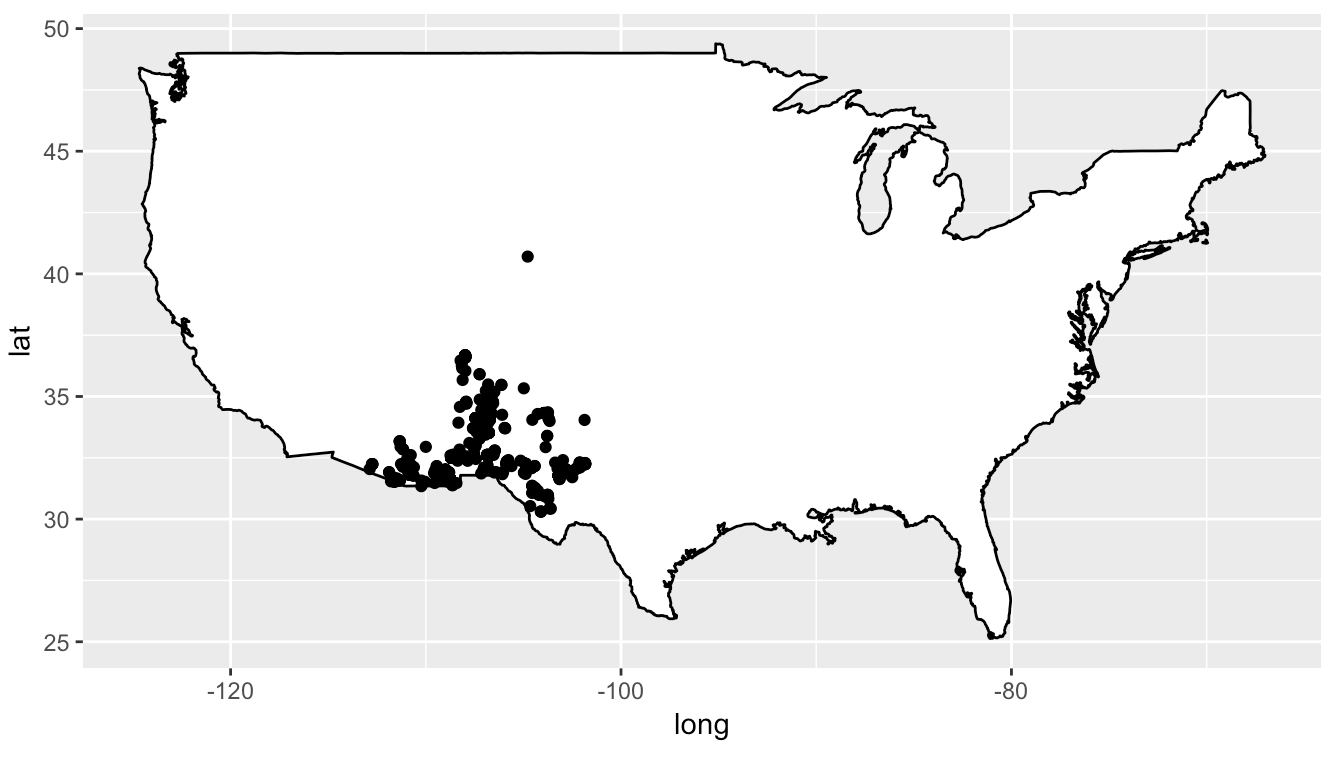
rename function from dplyr to rename the second and third columns of this dataset to longitude and latitudeDipodomys_spectabilis.basisOfRecord that is PRESERVED_SPECIMEN and a Dipodomys_spectabilis.countryCode that is US0 for latitude or longitudelatitude and longitude using selecthead() function to show the top few rows of this cleaned datasetusmap = map_data("usa")geom_polygon. In the aesthetic use group = group to avoid weird lines cross your graph. Use fill = "white" and color = "black".coord_quickmap() to automatically use a reasonable spatial projection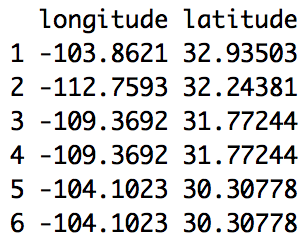