Data Science in Omics Introduction
An OMICS Course Part 1: Shell, Organizing and Genomics

The National Ecological Observatory Network has invested in high-resolution airborne imaging of their field sites.
Elevation models generated from LiDAR can be used to map the topography and vegetation structure at the sites.
This data gets really powerful when you can compare ecological processes across
sites.
Download the elevation models for the Harvard Forest (HARV) and San Joaquin Experimental Range (SJER)
and the plot locations for each of these sites.
Often, plots within a site are used as representative samples of the larger site
and act as reference areas to obtain more detailed information and ensure
accuracy of satellite imagery (i.e., ground truth).
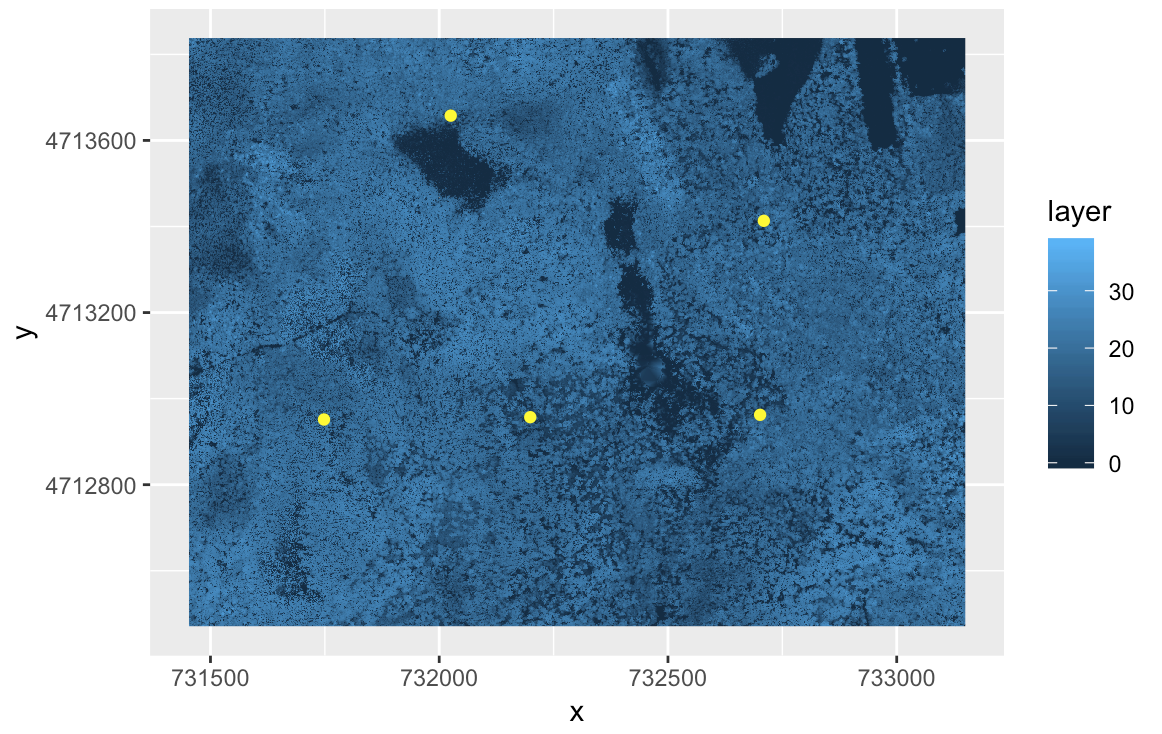
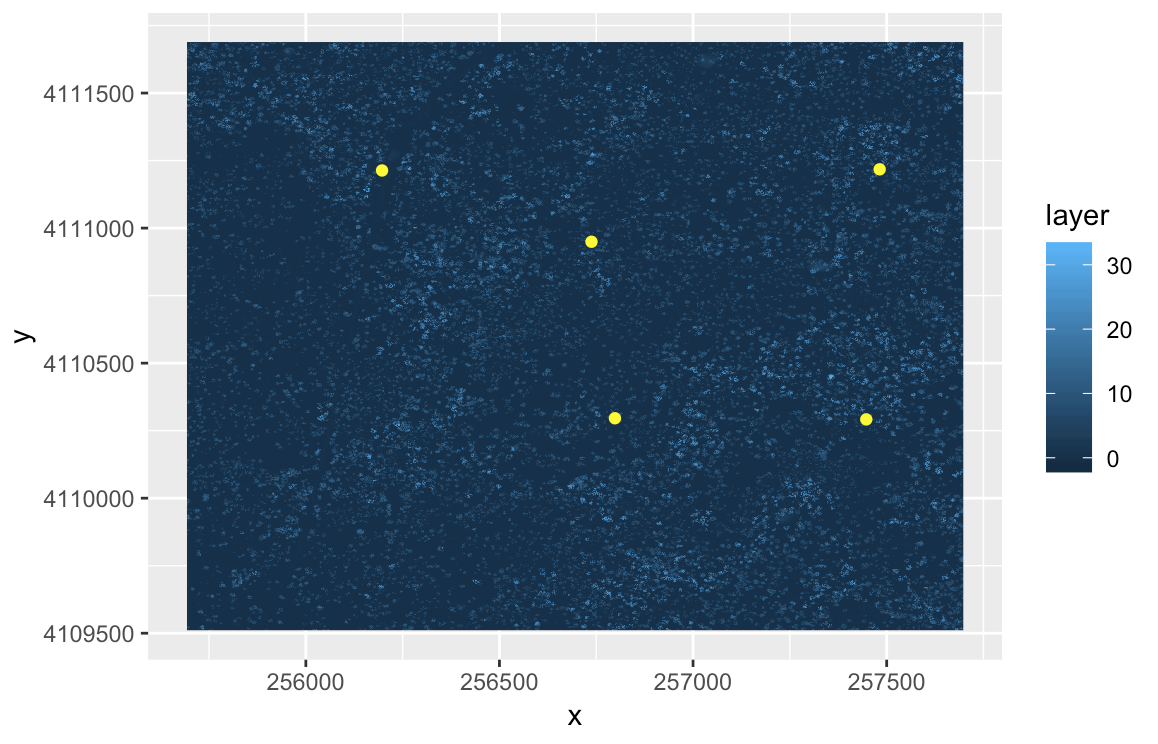
Create two Canopy Height Models using simple raster math (chm = dsm - dtm), one for the HARV site (which was done during the lecture) and another for the SJER site.
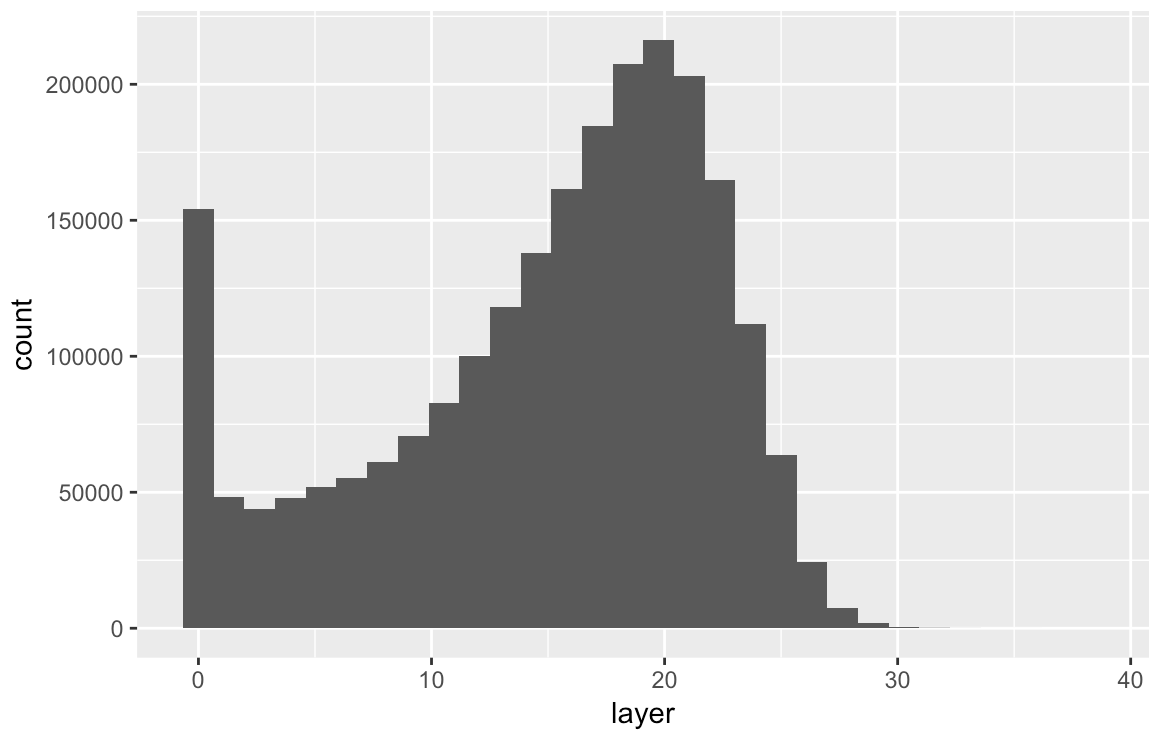
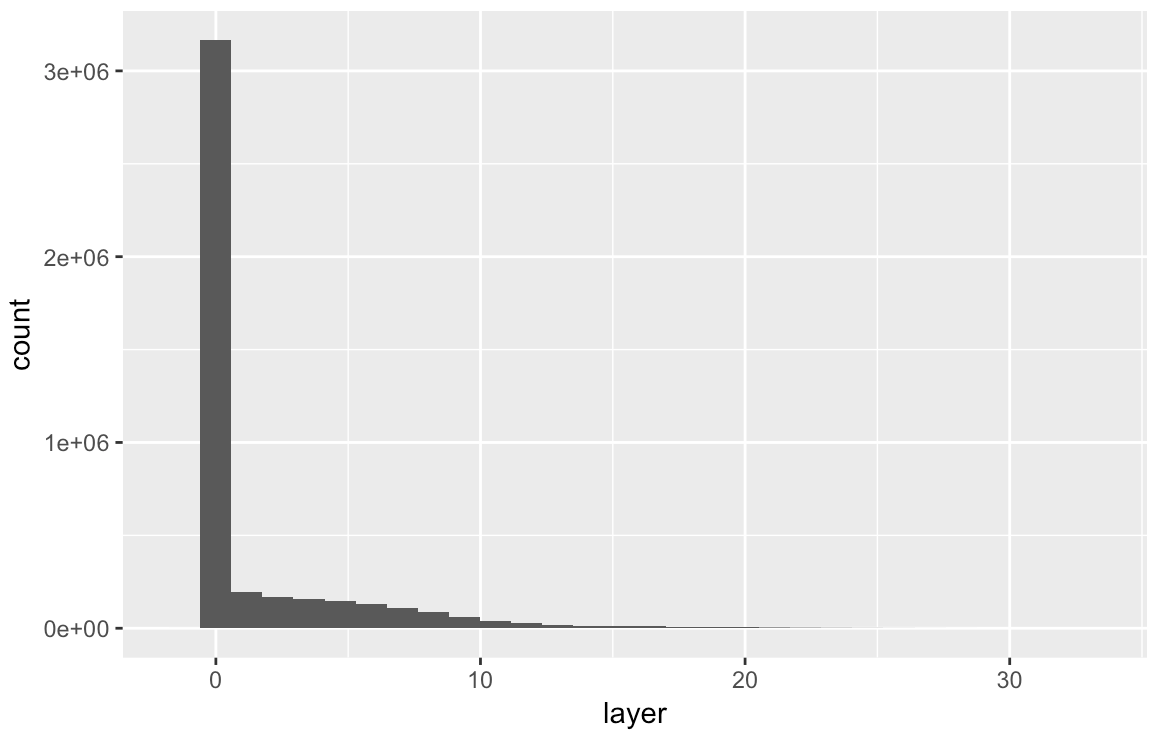
Create plots and histograms of canopy heights for both of the sites using ggplot.
Add corresponding points from plot_locations folder to each site plot.
Create a single dataframe with two columns, one of the maximum canopy heights for each point at the HARV site and one for the SJER points’ maximum canopy heights. When extracting the canopy height values, use a buffer of 10.