Data Science in Omics Introduction
An OMICS Course Part 1: Shell, Organizing and Genomics

You are interested in understanding whether sexual size dimorphism is a general pattern in birds.
Download and import a large publicly available dataset of bird size measures created by Lislevand et al. 2007.
Import the data into R. It is tab delimited so you’ll want to use sep = "\t"
as an optional argument when calling read.csv(). The \t is how we indicate a
tab character to R (and most other programming languages).
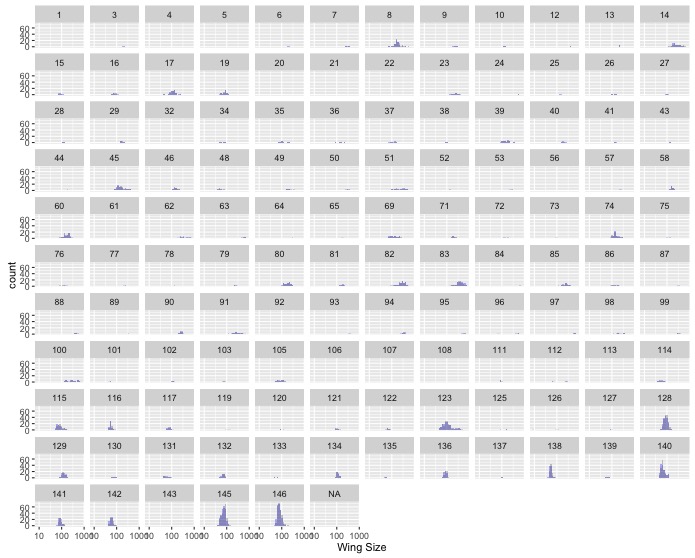
Using ggplot:
F_mass column). Change
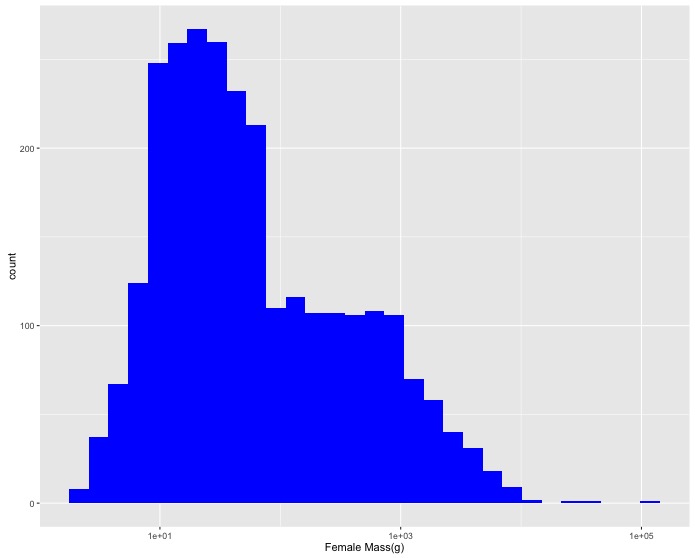
the x axis label to "Female Mass(g)".log10 scaled
version. Change the x axis label to "Female Mass(g)" and the color of the
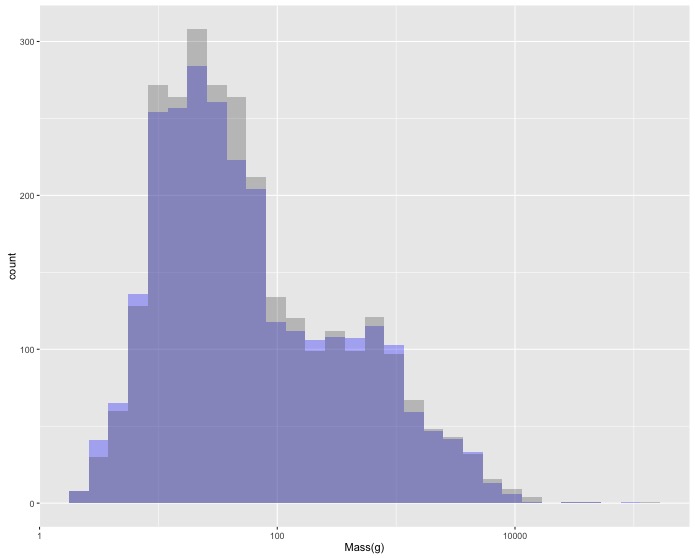
bars to blue (using the fill = "blue" argument).geom_histogram() layer that specifies a
new aesthetic. To make it possible to see both sets of bars you’ll need
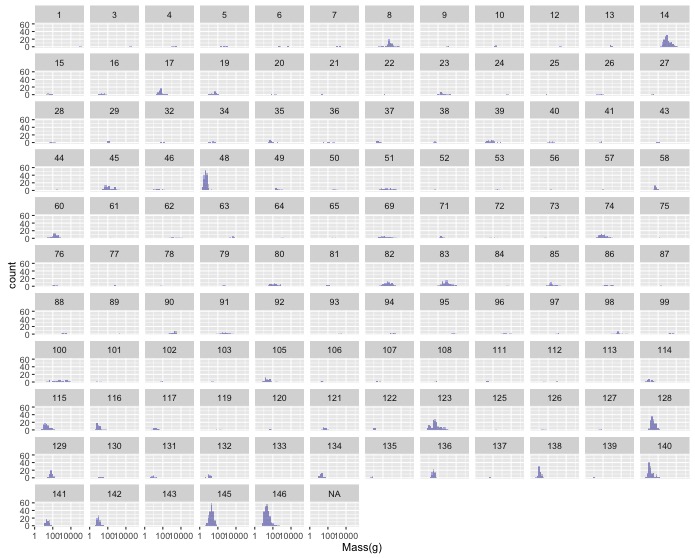
to make them transparent with the optional argument alpha = 0.3.facet_wrap() to make one
subplot for each family.na.strings = c(“-999”, “-999.0”)
argument in read.csv() to tell R what value(s) indicated nulls in a
dataset.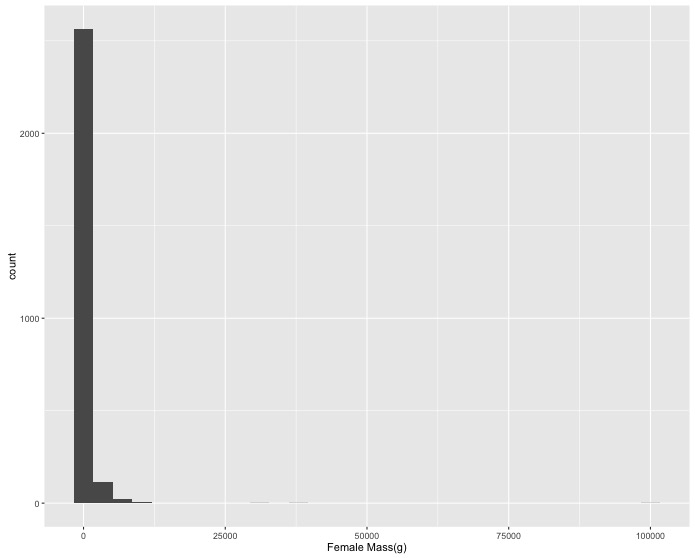